Market Overview: April 2025

This blog post will cover:
- Trade Wars: How Geopolitics Is Shaping the Market
- Bitcoin Performance in April
- Ethereum Performance in April
- Trading Activity and Volumes
- Top Gainers and Losers
- Google Trends Analysis
- The OM Incident: A Stark Reminder of Market Risks
- Market Sentiment in April
- What to Watch in May
- Technical Outlook for BTC and ETH
- Conclusion
After a grueling first quarter, the crypto community entered April with cautious optimism. Historically, April has offered the market a sense of hope. In Bitcoin’s trading history, April has closed in the green 7 out of 12 times. Notably, in 5 of those 7 instances, gains exceeded 30%, reflecting a seasonal uptick in risk appetite among market participants.
But this year, April wasn’t met with confidence — it was approached with anxiety. Q1 was one of the worst in crypto market history. Ethereum had posted three consecutive months of decline, and overall sentiment was deeply negative. As we noted in our March report, the market had raised more questions than answers, and April carried the suspense: would it mark a turning point, or confirm the onset of a prolonged bear trend?
Fortunately for the bulls, April delivered some relief. Despite a bleak start and overwhelming pessimism, the second half of the month marked a shift. By month’s end, April closed in the green — Bitcoin rose 14.08%. Market participants began to cautiously speak of recovery, with renewed hope for continued growth.
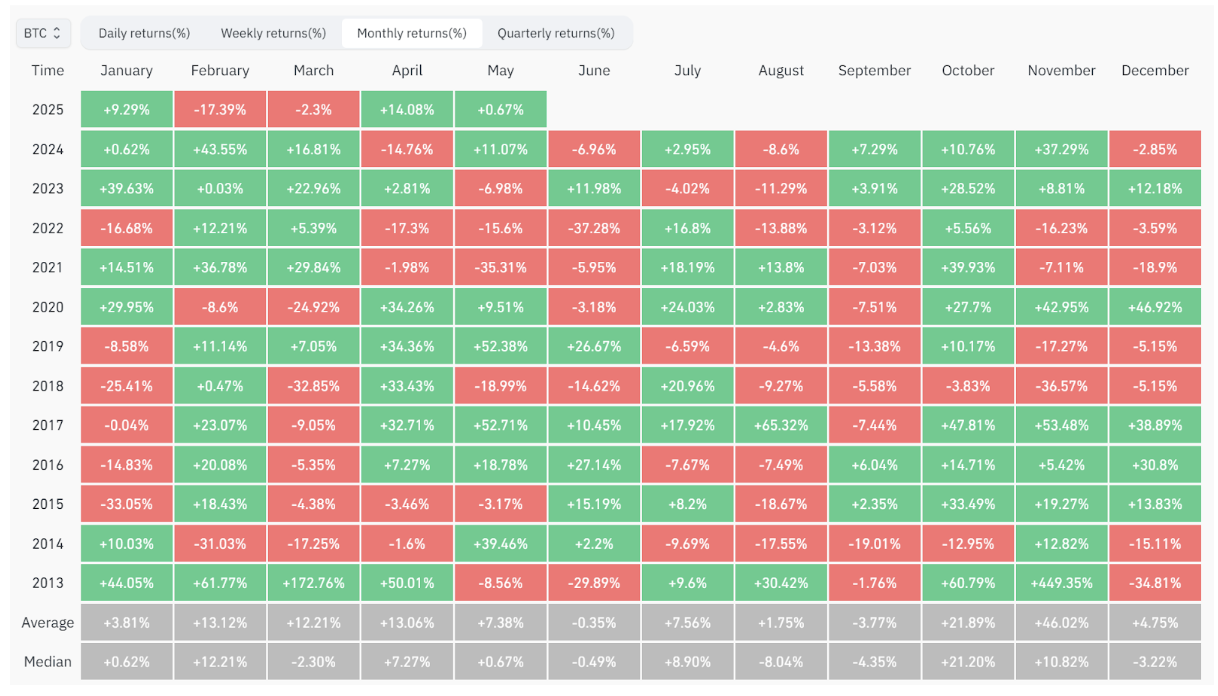
Historical BTC Performance | CoinGlass
In this report, we’ll examine the key events of the month, including geopolitical factors such as Trump’s trade tariffs and their impact on the crypto market. We’ll also review trading volumes, Bitcoin and altcoin price action, and attempt to answer the core question: does the market have a real chance at sustainable recovery, and what might trigger the next growth phase?
Trade Wars: How Geopolitics Is Shaping the Market
The month’s defining development was the introduction of new trade tariffs announced by Donald Trump. These came into effect on April 2 and immediately fueled volatility across all markets — from equities to commodities to crypto. While crypto was once seen as detached from traditional finance, it’s now a fully integrated part of the global financial system and highly sensitive to external shocks.
Tariffs are a time-tested economic weapon. History is full of examples where trade restrictions were used for political leverage. From medieval embargoes and the Anglo-Dutch rivalries to Napoleon’s Continental Blockade — nations have long wielded economic tools in geopolitical conflicts.
In April 2025, rhetoric around tariffs dominated headlines. Market movements were often more a reaction to statements, leaks, and speculation than to actual policy changes. Price swings were driven by expectations rather than fundamentals.
To better understand the potential impact of tariffs, it’s helpful to look at historical trade wars and how markets have responded:
Historical Examples of Tariffs and Their Market Impact
1. 1930: Smoot-Hawley Tariff Act (USA)
Over 20,000 goods hit with tariffs up to 48%
Retaliation from dozens of countries
Global trade dropped 66%
Dow Jones fell 89%, S&P 500 dropped 86%
Widely blamed for deepening the Great Depression and exacerbating the market crash
2. 1980s: U.S.-Japan Trade War
Tariffs and quotas on cars and electronics
A stronger yen hurt Japanese exports
Culminated in the 1987 "Black Monday" crash: Nasdaq -40%, S&P 500 -34%
Though causes were multifaceted, trade tensions heightened instability
3. 2002: U.S. Steel Tariffs
Up to 30% tariffs on imported steel
EU and Japan contested the move at the WTO and threatened retaliation
Amid an already bearish market, S&P 500 fell another 34%, Nasdaq nearly 50%
Tariffs weren’t the crisis trigger but amplified short-term pressure; markets recovered quickly afterward
4. 2018–2020: U.S.-China Trade War
Up to 25% tariffs on Chinese goods
China responded with reciprocal measures
Agriculture and tech supply chains took a major hit
S&P 500 fell 20% in 2018, then rebounded
This marked the first direct impact on the crypto market — Bitcoin dropped over 51% to $3,300 before beginning a new bull cycle
Key Takeaways: What History Tells Us
Tariffs consistently trigger short-term volatility due to sensational headlines and fear of escalating trade wars. The market’s response depends on the prevailing trend. In a bearish environment, tariffs can deepen the downturn and delay recovery. In a bullish environment, markets tend to absorb the shock and resume upward movement faster. In April 2025, tariffs once again became a catalyst for sharp volatility.
Bitcoin Performance in April
Following the announcement of new trade tariffs on April 2, panic swept through the markets. Media outlets and analysts began warning of a new trade war, prompting investors to quickly close their positions. The tariffs impacted 180 countries, with Trump imposing a baseline import duty of 10%. For some nations, rates were even higher. As a result, by April 7, Bitcoin had dropped to $74,500 — down nearly 16% from recent highs.
That level marked the monthly low, and beginning April 9, the situation started to reverse rapidly. Market participants appeared to realize there were no strong fundamentals to justify further decline, and liquidity continued flowing into the crypto sector. Bitcoin rebounded quickly and, by mid-month, had returned to the $85,000 range, where it consolidated for a short time.
Toward the end of April, the bullish momentum resumed. The asset gained strength amid softening rhetoric around tariffs, renewed interest in risk assets, and continued capital inflows — both via Bitcoin ETFs and other channels. By April 22, BTC had climbed above $92,000, eventually closing the month at $94,170. April once again proved positive for the leading cryptocurrency. From the start of the month, Bitcoin gained 14.08%, and from its low to high, the increase was over 28%.
Despite the significant external shock from U.S. tariffs, the market recovered quickly. Bitcoin confirmed that it remains in a strong upward trend. This kind of resilience is typical of bull markets, where investors treat corrections as entry opportunities rather than panic triggers.
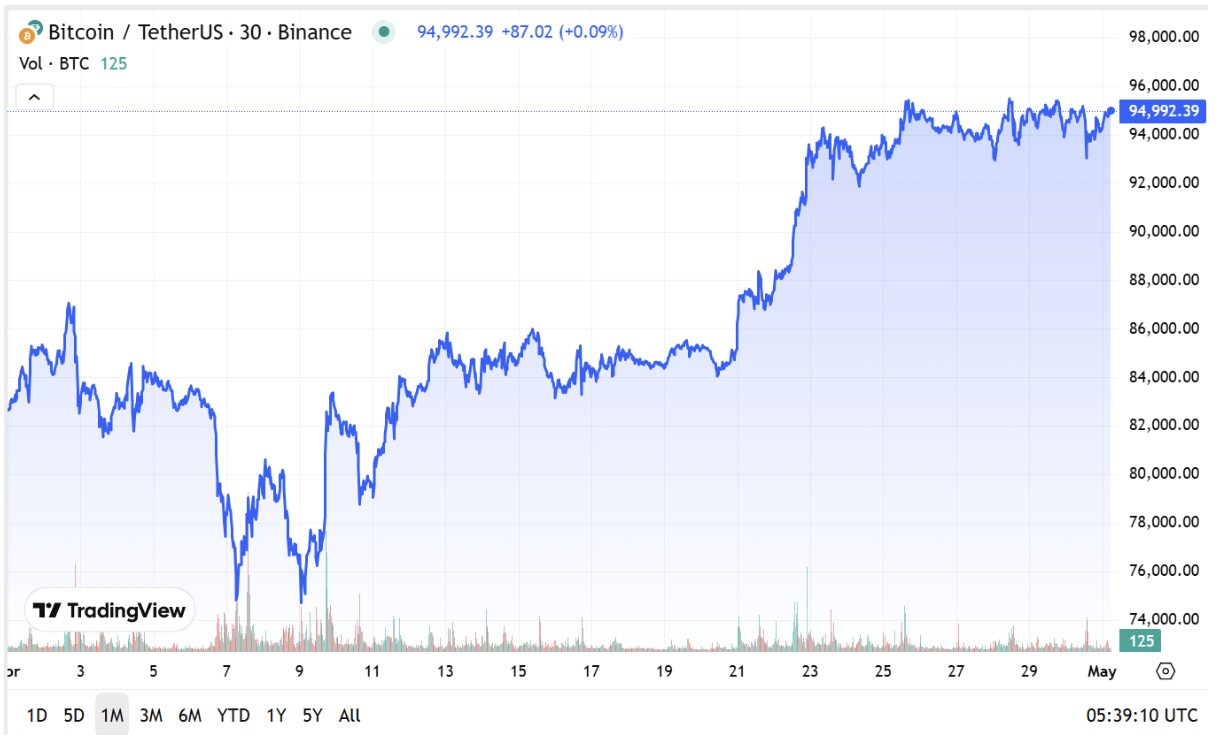
Bitcoin (BTC) Chart. Source: Cryptorank
Ethereum Performance in April
Ethereum entered April after four consecutive months of decline — a negative streak seen only once before, back in 2018. Given the asset’s weakness, rising geopolitical tensions, and looming tariff concerns, a bullish reversal at the start of the month was unlikely. That’s exactly what happened: ETH opened April at $1,821 but dropped nearly 24% by April 9, hitting a monthly low of $1,385.
Ethereum then began to recover alongside Bitcoin, but unlike BTC, it failed to demonstrate real strength. By the end of April, ETH had merely returned to its opening levels, closing the month with a modest loss of 1.59%.
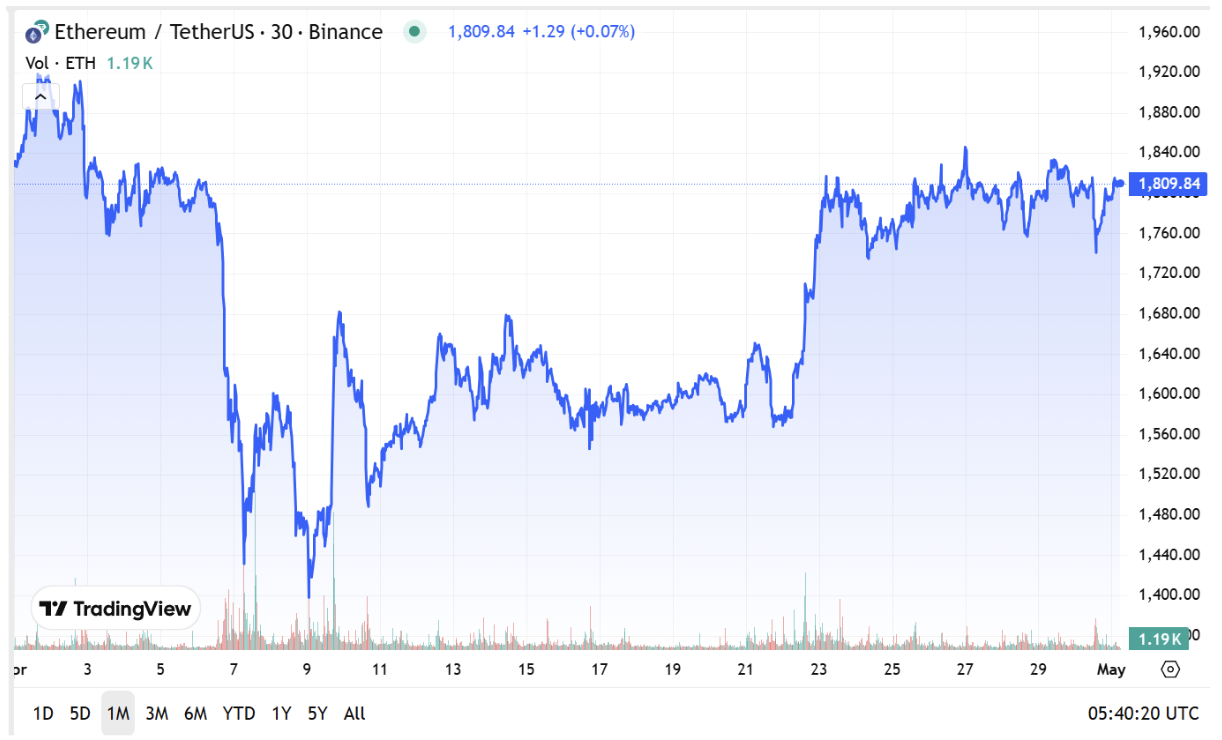
Ethereum (ETH) Chart. Source: Cryptorank
Despite its current weakness, it’s too early to write Ethereum off. Its ecosystem continues to expand — Layer 2 activity is increasing, total value locked (TVL) in Ethereum is growing, new projects are launching, and the network is progressing with updates. In crypto, we often see capital rotation: Bitcoin rises first, followed by liquidity flowing into Ethereum and major altcoins. As such, the coming months may prove more favorable for ETH — its time may still lie ahead.
Trading Activity and Volumes
Spot trading volumes on centralized exchanges in April 2025 dropped to their lowest level of the year, totaling $1.28 trillion. The year-to-date trend shows a steady decline in trading activity: $2.32 trillion in January, $1.77 trillion in February, and $1.38 trillion in March.
This decline is attributed to several factors:
Major cryptocurrencies posted significant losses in Q1, which dampened the interest of both traders and long-term investors.
High volatility and broad market declines led to large-scale liquidations, causing many participants to adopt a wait-and-see approach.
The market remains in limbo, with many believing a full-fledged bear market has begun. This lack of conviction is reflected in the reduced trading volumes.
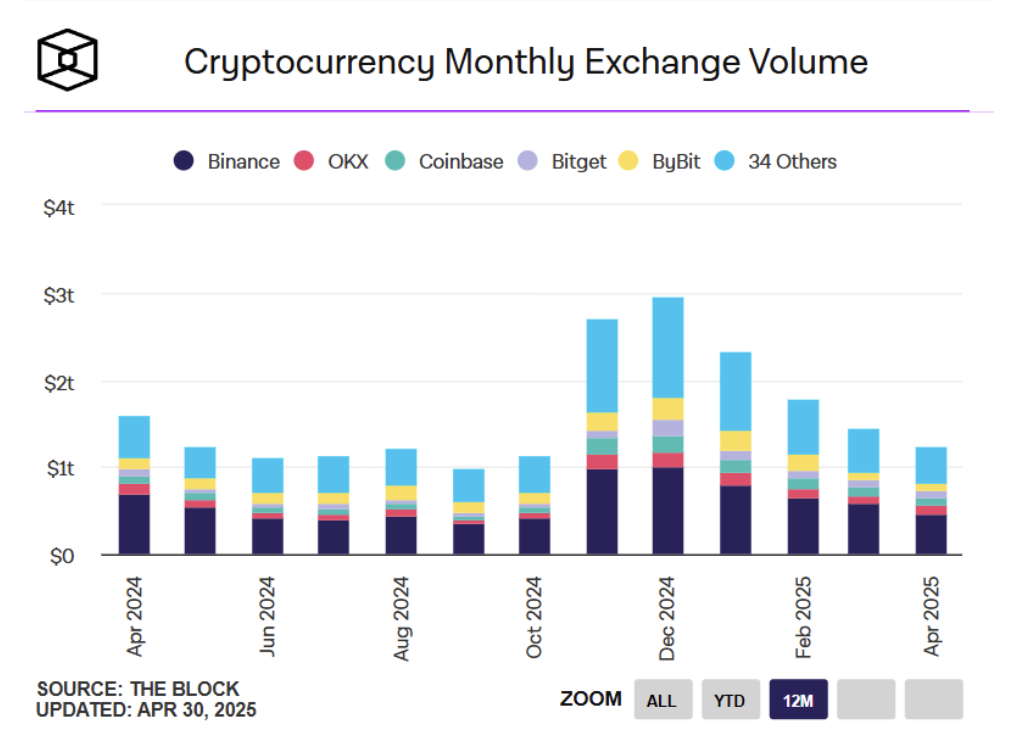
Spot Trading Volume on CEX. Source: The Block
Trading volume on decentralized platforms also remained weak, coming in at $201.4 billion in April. While not the lowest of 2025, it’s comparable to March. Despite the market downturn and reduced CEX activity, trading on DEXs held steady — underscoring sustained interest in cryptocurrencies and DeFi products.
Even in a bearish environment, there were some positive signals:
Users continue to actively trade on DEX platforms, demonstrating strong adoption of decentralized finance.
Despite falling liquidity and persistent uncertainty, DEXs still generated significant volumes, highlighting their vital role in the crypto ecosystem.
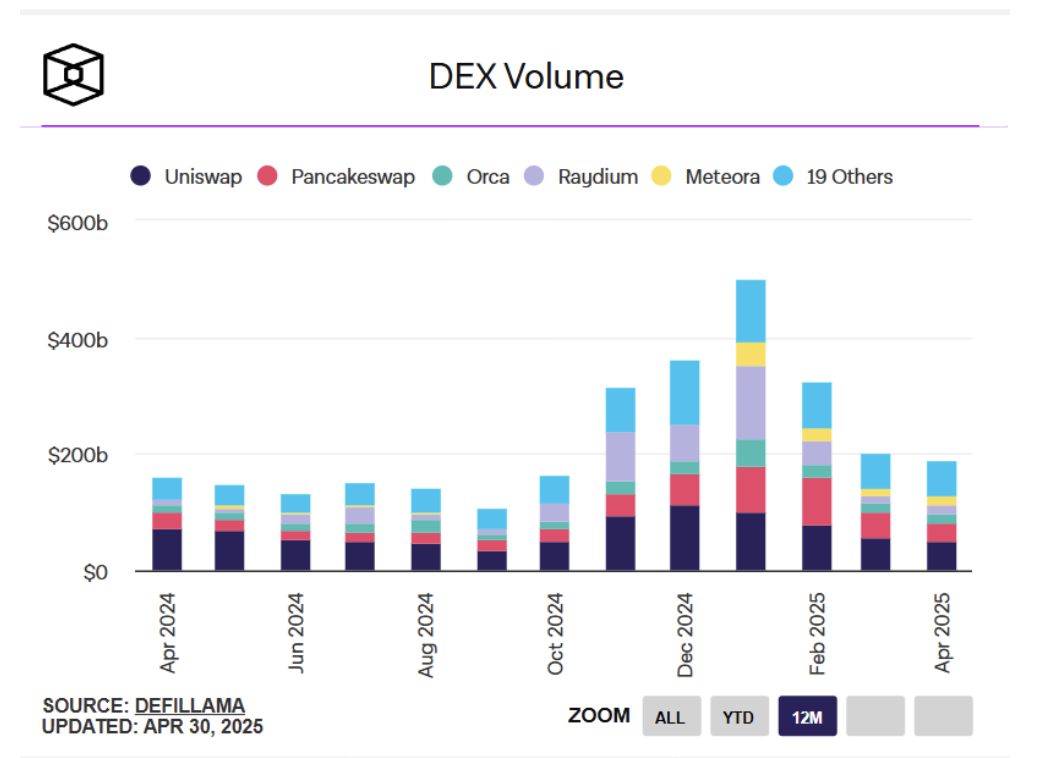
Spot Trading Volume on DEX. Source: The Block
Top Gainers and Losers
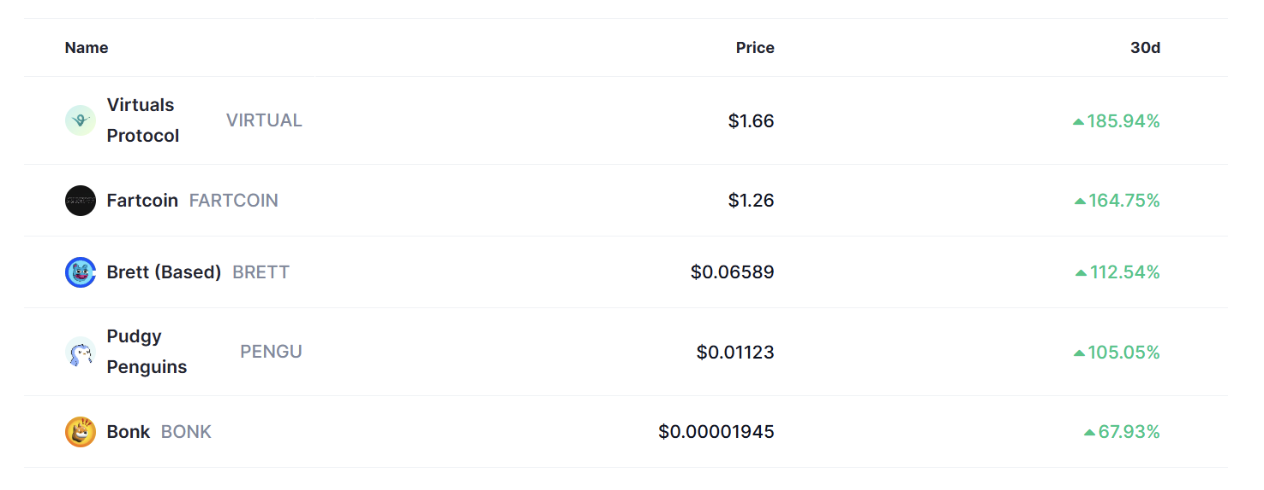
April showed early signs of recovery, and several tokens posted strong gains:
Virtuals Protocol (VIRTUAL): +185.94% – A cryptocurrency focused on virtual interaction, utilizing its own AI protocol and metaverse integration.
Fartcoin (FARTCOIN): +164.75% – Another memecoin that unexpectedly captured trader attention.
Brett (BRETT): +112.54% – A cult icon on the Base network with a dedicated fanbase.
Pudgy Penguins (PENGU): +105.05% – A symbol of community, memes, and positive vibes.
Bonk (BONK): +67.93% – A popular Solana memecoin experiencing renewed momentum.
In previous months, only a few assets showed gains above 100%, reflecting low volatility. In April, that pattern shifted. While the market remains in a cooling phase — evident through subdued volumes and cautious price action — select trends, especially in high-risk sectors, began to re-emerge.
Top Gainers & Losers. Source: CoinMarketCap
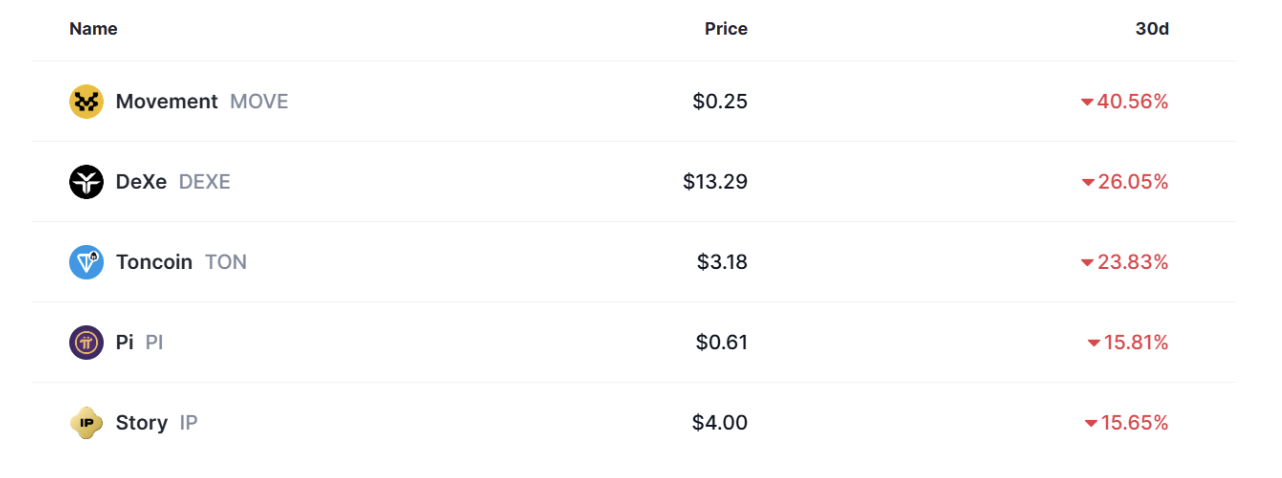
The biggest underperformers in April included:
Movement (MOVE): -40.56% – The first Move-EVM Layer 2 for Ethereum, aimed at integrating the Move language into the blockchain ecosystem.
DeXe (DEXE): -26.05% – Infrastructure for creating and managing DAO solutions.
Toncoin (TON): -23.83% – A correction following hype and overextension after Durov’s release in March.
Pi (PI): -15.81% – A social cryptocurrency and developer platform.
Story (IP): -15.65% – A Layer 1 blockchain built to serve as the foundation for intellectual property online.
Top Gainers & Losers. Source: CoinMarketCap
Interestingly, there was no dominant sector among the month’s losers — each token had its own reason for decline, ranging from waning media attention to technical stagnation. This suggests the market’s pullback in April was not systemic but selective.
However, among the top gainers, memecoins once again stood out. Memecoins, which had faded into the background in recent months, suddenly came back to life in April. As noted in previous reports, this may be an early signal of shifting market sentiment. When retail interest returns to high-risk assets, it often precedes broader market engagement. April may mark the first step toward recovery.
Google Trends Analysis
In April, we began regularly tracking cryptocurrency trends on Google, highlighting the most frequently searched projects. This data helps identify which coins and sectors are drawing the most user interest and reveals the narratives investors are emotionally engaged with.
Search engine activity often precedes price rallies — heightened interest can act as fuel for new price surges, especially in the case of memecoins. One standout example from April was FARTCOIN, a viral Solana-based memecoin that appeared multiple times in Google's trending searches. It ultimately became the second-best performing token of the month, gaining over 160%.
Besides FARTCOIN, users showed significant interest in the following projects:
TRUMP – A memecoin linked to Donald Trump, which gained momentum after news of a meeting with token holders.
Hyperliquid (HYPE) – A derivatives DEX with an on-chain order book, which saw a spike in attention amid rising interest in decentralized trading platforms.
FET, TAO, FHE – AI-related projects that continue to stay in the spotlight as decentralized AI infrastructure gains traction.
Heroes of Mavia, Immutable X – GameFi projects that recaptured investor attention thanks to new game launches and collaborations with mainstream studios.
Key Takeaways from April Trends
AI & Decentralization: Protocols offering independent, private, and distributed solutions for artificial intelligence are forming the foundation of the next growth wave. While still far from mainstream adoption, interest in these projects is steadily increasing.
Memecoins: As with the start of every bullish cycle, memecoins are once again the first to capture mass attention. This is an early signal of renewed appetite for risk.
GameFi: Gaming projects are back in focus. With new releases and partnerships with traditional publishers, this sector could be primed for another growth phase.
Google Trends serves as a valuable early indicator of investor interest. In April, memecoins and AI were the primary drivers of search interest, signaling a revival in retail enthusiasm and a rise in speculative activity as the market began to recover.
We’ll continue to publish these insights on social media and in our monthly reports to track emerging narratives and trending tokens. Follow us on X, Telegram, and Discord where we share regular updates on Google Trends.
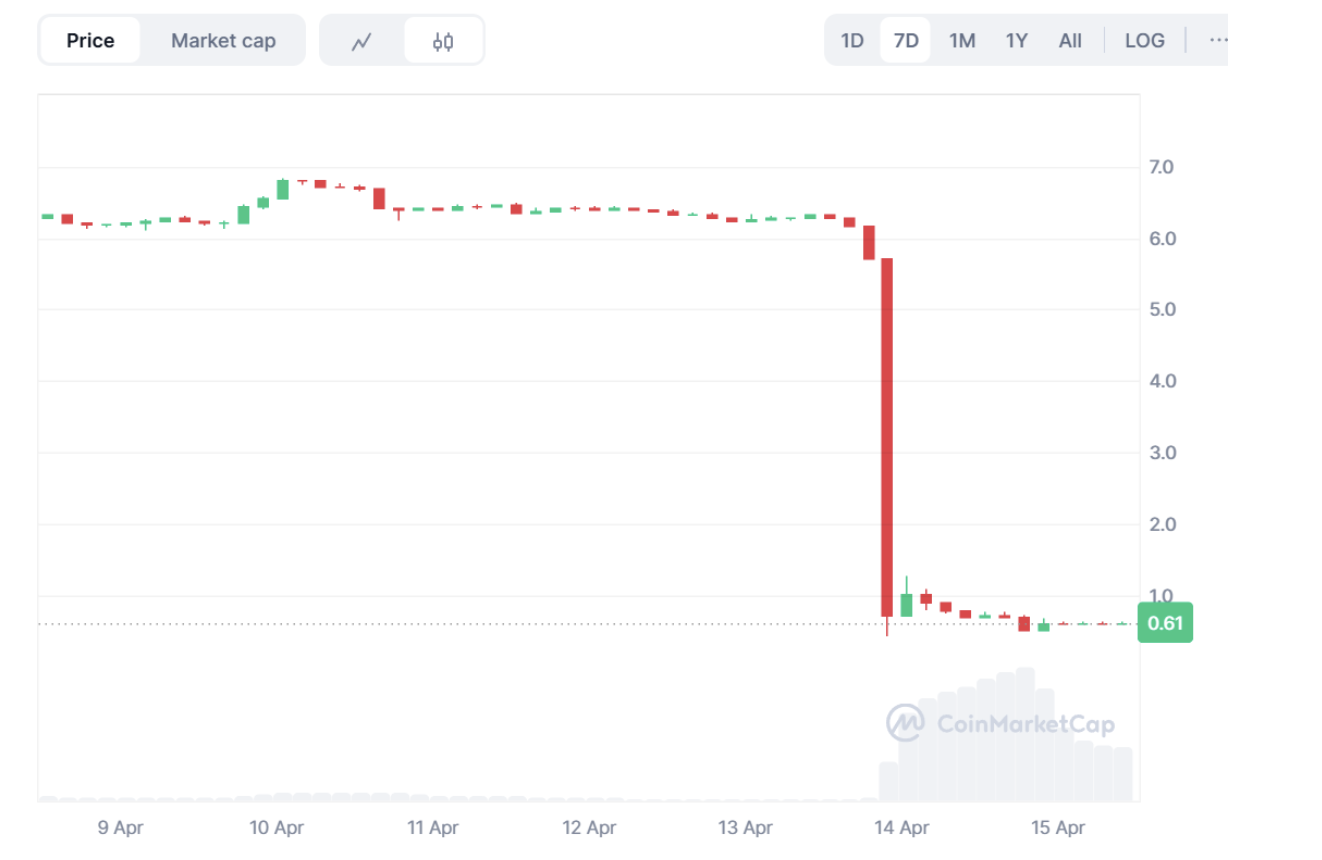
The OM Incident: A Stark Reminder of Market Risks
In mid-April, a notable incident occurred that, while it didn’t impact the overall market trend, served as a sobering reminder of the risks traders face in highly volatile environments. The token OM from the MANTRA project — once valued at over $6 billion — crashed by 94% within just a few hours.
OM is a Layer-1 blockchain focused on the tokenization of real-world assets (RWA), with a strong emphasis on regulatory compliance. The project aims to build a bridge between traditional finance and Web3, providing infrastructure for tokenized bonds, real estate, and investment funds. Fueled by growing interest in RWAs and consistent team efforts, OM surged by more than 160x from its lows and became one of the flagship projects in the institutional DeFi narrative.
However, on April 13, OM suddenly plunged 94%. Binance and OKX reported cross-exchange liquidations, Lookonchain tracked large transfers to exchanges, and analyst ZachXBT suggested that known market manipulators may have been involved.
Source: CoinMarketCap
The scenario resembled a classic pump-and-dump scheme with elements of a coordinated market attack. Even if malicious intent isn't conclusively proven, the combination of low liquidity, large transfers, and leveraged positions created perfect conditions for manipulation.
Regardless of who triggered the dump — massive sell-offs, coordinated moves, or unfortunate coincidences — the ones most affected were traders using margin and leverage. We recommend spot trading as a safer alternative when dealing with volatile and illiquid tokens. This can help investors avoid cascading liquidations and unpredictable losses like those seen with OM.
Market Sentiment in April
Market sentiment remains a critical leading indicator, as periods of fear inevitably give way to euphoria — and vice versa. After experiencing deep fear in February and March, April also largely remained in the fear zone. At the beginning of the month, the Fear and Greed Index hit extremely low levels, reflecting panic caused by geopolitical tensions and downward pressure on the crypto market.
It wasn't until the final third of the month — after Bitcoin broke above $95,000 and select altcoins saw explosive growth (some gaining over 100%) — that the index moved into the neutral zone. Yet even then, greed failed to emerge. The dominant market mood was still one of indifference and distrust.
This signals a market stuck in a phase of deep pessimism. Despite how hopeless it may feel, historically, such psychological states have often marked turning points, serving as launchpads for new growth cycles.

Fear and Greed Index. Source: CoinMarketCap
What to Watch in May
If March left the market with more questions than answers, and April was seen as a potential turning point for the crypto market, then May arrives with a noticeable sense of anticipation. In April, Bitcoin proved its resilience — withstanding geopolitical pressure and closing the month with strong gains. This gave the market a glimmer of hope for a possible trend reversal, even though overall sentiment remains cautious. Now, investors are focused on May, which could mark the transition from a depressive phase to one of recovery and growth.The main event of the month is the Federal Reserve’s policy meeting on May 7, which could serve as a pivotal moment.
Technical Outlook for BTC and ETH
In April, Bitcoin showed notable strength, ending the month near the $95,000 level, with clear intentions to break through. The next key level is $97,000. A weekly close above that level would likely act as a catalyst for further upside, possibly paving the way to new all-time highs. However, this is a strong resistance zone, and the probability of a pullback remains high. If a correction occurs, the 50% Fibonacci retracement level from the recent rally becomes an attractive buying zone.
Ethereum, on the other hand, lacked conviction in April, ending the month near its opening levels. From a technical perspective, the outlook hasn’t changed. The key psychological milestone remains reclaiming the $2,000 level. A firm close above $2,200 would confirm buyer strength and could signal a broader revival in the altcoin sector.
Conclusion
April 2025 was a month of hope — and possibly a turning point — following one of the weakest quarters in crypto history. Despite geopolitical headwinds in the form of U.S. trade tariffs, Bitcoin not only held steady but gained more than 14% during the month, showcasing its strength. This affirms that the market is still in a bullish phase, where corrections are seen as opportunities to accumulate rather than reasons to panic.
April began under a cloud of negative expectations and geopolitical tension but ended with a sense of cautious optimism. The community is fatigued; the market has spent a prolonged period in depression. However, Bitcoin’s strength, renewed interest in meme coins, and signs of life in altcoins all point toward a possible trend reversal.
Trading activity on centralized exchanges continues to decline, reflecting investor caution and a broader cooling toward risk assets. Against this backdrop, consistent activity on DEX platforms stands out as a positive signal — a sign that foundational demand for DeFi remains intact.
The market is undoubtedly still in a zone of turbulence, but May could be the month that defines a new medium-term trend. Historically, May has been a tricky month for financial markets, hence the old saying: “Sell in May and go away.” Despite signs of recovery and a glimmer of hope, the month’s seasonal reputation fuels skepticism. But it's precisely this mix of growing optimism and lingering doubt that creates the perfect environment for an unexpected breakout.
When most participants are reluctant to hold positions, major players can capitalize on low resistance and engineer a move higher. That’s what adds to the suspense — May 2025 might well go down in history as the turning point.
SimpleSwap reminds you that this article is provided for informational purposes only and does not provide investment advice. All purchases and cryptocurrency investments are your own responsibility.